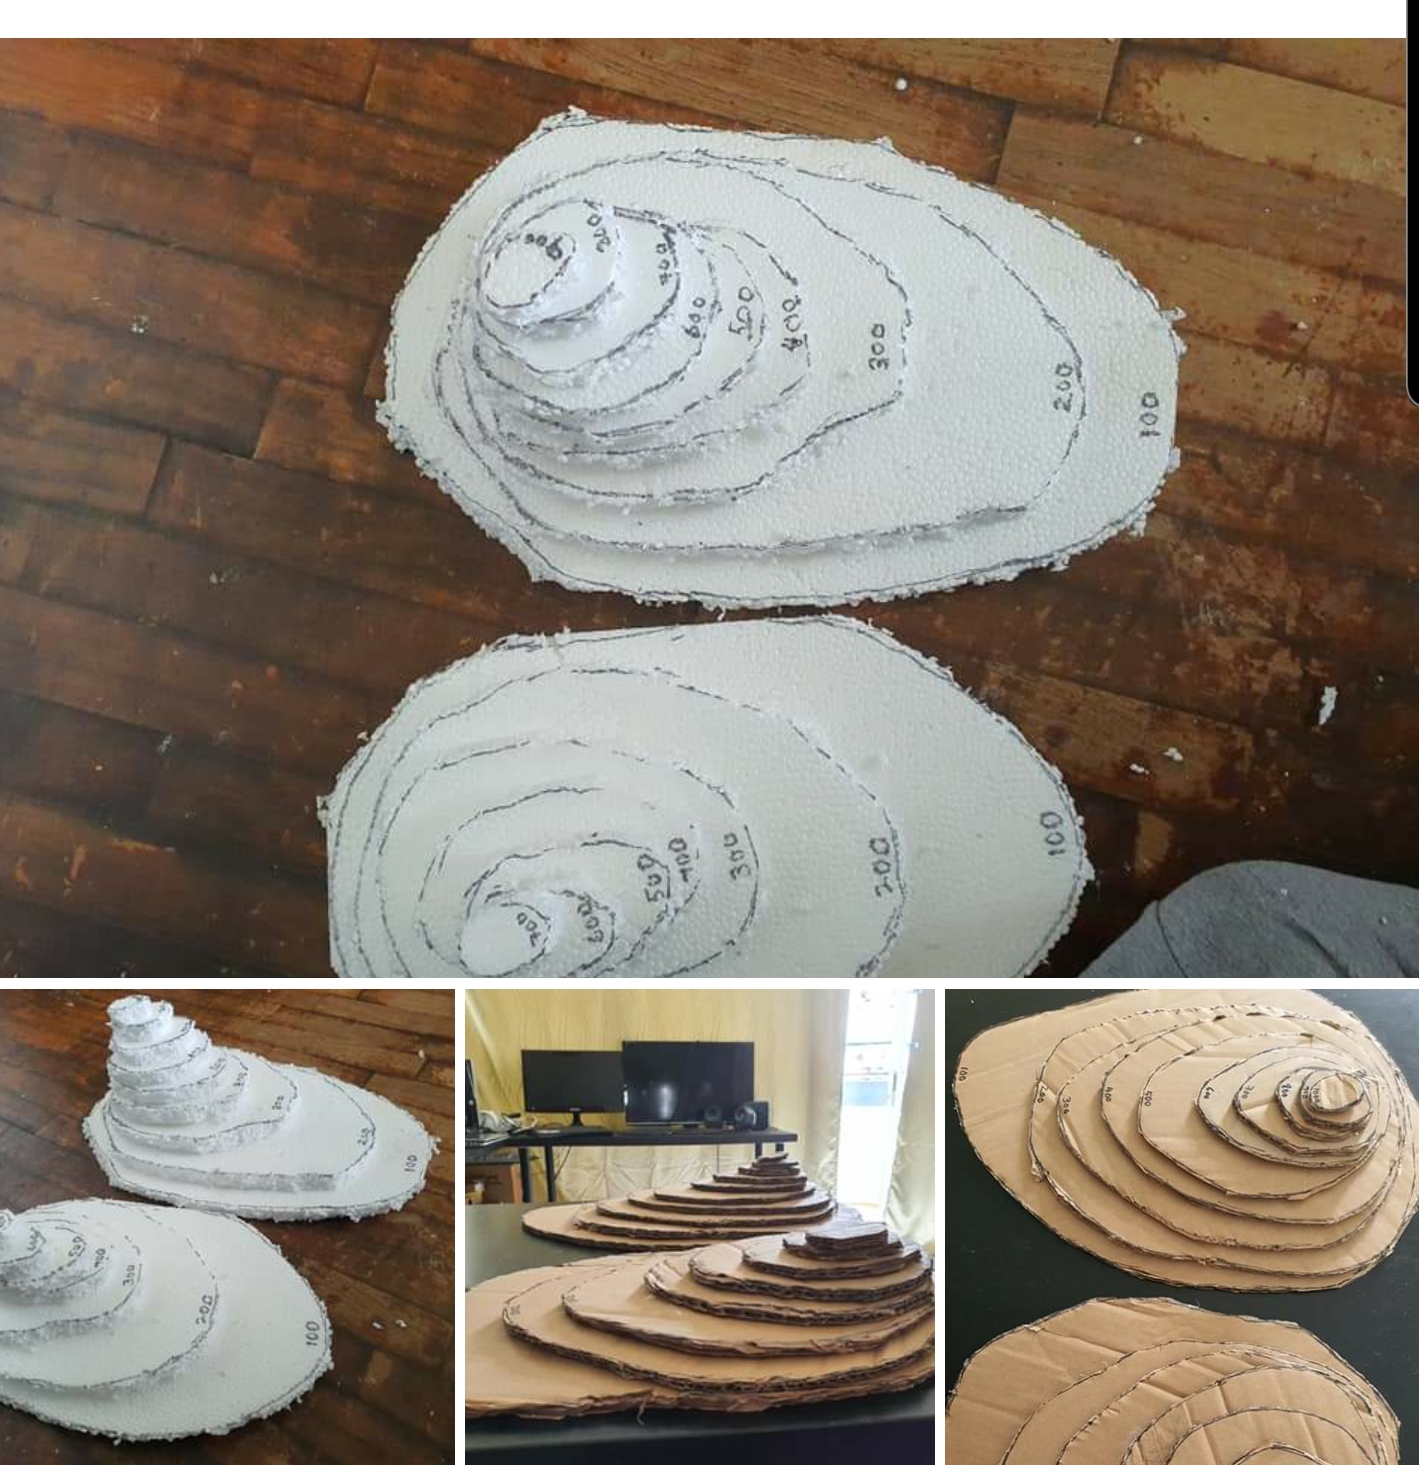
The video below is a 360 video I took of the Chinatown LJ for Tourism GI I have conducted in 2020. You can
also move horizontally through the 360 video by dragging your finger across the
screen if you are using your handphone. You may also pause the video and swipe
on the screen for the 360 view. Though you cannot experience the smell, the
sight and sound would be an amazing VR experience. You can watch it in VR if you open up the video in Youtube. Experience the virtual reality with VR glasses.
Virtual Tourism GI
More of 2020 tourism GI here
Did a virtual Coastal GI in UK too using Google Earth. An overseas virtual learning journey!
Gotten the students to make observation using street view as well using the ruler in Google Earth to do measurements. I actually gotten the students to 'fly' back to Singapore to compare the size of the one we have at ECP with that in UK. Gotten them to think why are the breakwaters wider in UK.
Google Earth Kmz file and worksheet I have created can be downloaded from my Google site @
Sec 1 virtual Water GI using Google Earth. Let's fly over to Lorong Halus!
Students learn more about the history of the place.
https://sites.google.com/a/moe.edu.sg/sec-1-geog/geographical-investigation/5-lorong-halus-wetlands
They can also see how the place was in the past using the time slider with Google Earth.
https://sites.google.com/a/moe.edu.sg/sec-1-geog/google-earth
Then visit the various location via the street view on Google Earth.


 An annotated sketch submitted by a Sec 1 student.

Updated 5 June- Alex shared on the following 360 video of the Toa Payoh Neighbourhood.
This also reminded me of the sharing on using VR for Housing GI shared by Hua Yi sec
http://geogshare.blogspot.com/2019/11/vr-in-geography.html
Students learn more about the history of the place.
https://sites.google.com/a/moe.edu.sg/sec-1-geog/geographical-investigation/5-lorong-halus-wetlands
They can also see how the place was in the past using the time slider with Google Earth.
https://sites.google.com/a/moe.edu.sg/sec-1-geog/google-earth
Then visit the various location via the street view on Google Earth.


Will be customising the 2021 SLS lessons on GI to that on Lorong Halus. Will do the sharing on SGLDC on 23 Nov!
For sec 2 we actually gotten the students to annotate a picture of their neighbourhood to show why it is a unique place for them. Some were not able to be there so they made use of Google Earth and screenshot the street view/photo sphere for the 360 view. They could screenshot images of their neighbourhood and annotate them to show why it is unique to them.

Updated 5 June- Alex shared on the following 360 video of the Toa Payoh Neighbourhood.
This also reminded me of the sharing on using VR for Housing GI shared by Hua Yi sec
http://geogshare.blogspot.com/2019/11/vr-in-geography.html
Updated: use of VR in Geog and Eng by Ms Yong from Teck Whye Sec
Do also look at my earlier post on the use of MOE arcgis resources.
http://geogshare.blogspot.com/2020/03/arcgis-resources.html
I have always love Google Earth - My earlier posts on the use of Google Earth:
http://ezitnew.blogspot.com/search/label/Google%20Earth
The use of Google Earth definitely encourage real world exploration. It enables the students to overcome the constraints of space and time, bringing the world into the classroom. Google Earth allows students to locate and explore different parts of the world and the time slider allow one to compare the before-and-after images of an area. This can definitely help to spark curiosity about the causes and impacts of change as what I have mentioned earlier about the Sec 1's study of Lorong Halus.


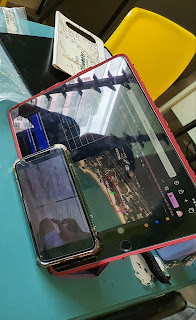


 My HOD help me to guide the students in using the ranging poles and clinometer in measuring the beach profile.
The use of Google Earth definitely encourage real world exploration. It enables the students to overcome the constraints of space and time, bringing the world into the classroom. Google Earth allows students to locate and explore different parts of the world and the time slider allow one to compare the before-and-after images of an area. This can definitely help to spark curiosity about the causes and impacts of change as what I have mentioned earlier about the Sec 1's study of Lorong Halus.
In instances where the location of a study is difficult to reach, teachers can take students on virtual tours. Virtual tours may be in the form of the drag and drop Pegman icon on Google Street View's 3D view. The students could take a virtual trip to see why Machu Picchu in Peru attracts the tourists by moving around the ruins left by the Inca civilisation as well as experience the amazing view from the mountain top.
Students can zoom, pan, and rotate the orientations of their screen in Google Earth to help them understand geographical space, place, and scale. As mentioned above, the students can use the search and zoom functions on Google Earth to explore Lorong Halus. The ability to observe features in Google Earth by manipulating the map scale actively and easily allows students to have a better sense of how the waterway, e.g Punggol waterway, are connected at a locale and even factors that may affect the water quality in the waterway.
My Sec 3 students have also enjoyed measuring the breakwater in UK and compare that to the one at ECP using the ruler function in Google Earth. In doing so they could better understand the geographical concept of scale as well as making observations on the reasons for the difference in sizes. Spatial analysis could be carried out and exploration of the real world without them actually being there with virtual field trips!
Updated 20 Oct 2020
Updated below is my Sec 3 virtual Coastal GI. Making use of Google Earth to help them see the authencity of their "fieldwork", simulated GI with measurement using samples, model, video clips etc at 7 stations in school! The students collaborated in the collection of data using Google Sheets and represent their data using Google slides.
Google Earth allowed my students to "fly over" to East Coast Park and Tanjong Rimau in Sentosa which will not be possible without the use of technology. It had definitely redefined the tasks.
You can make a copy of the Google sheet which the students used to record their measurements.

The 5 stations at East Coast Park, Singapore.

The 2 stations at Tanjong Rimau in Sentosa.


Explanation on the data collection methods before getting the group's to rotate on the 7 stations.

Virtual flight to ECP via Google Earth. Students took a screen shot and annotate to explain their observation on coastal process, coastal features and human intervention.

Measuring the wave frequency from recorded video taken at ECP. Students imagine themselves to be at ECP looking at the place mark on Google Earth.

Sediment size analysis for larger sediment using a corner caliper.

Sediment size analysis for finer sediment using a weighing scale and sieves.

Measuring the slope of the beach facing the updrift and downdrift.


Cliff survey at the parade square. Measuring the height of the classroom block in place of the cliff.


Sec 1
Sec 2
Sec 3
Sec 4