Showing posts with label Geographical Inquiry Through Fieldwork. Show all posts

Monday, March 13, 2023

Inquiry-based learning in New Upper Sec Geog

Decided to carry out an inquiry-based learning on Geographical Methods under the topic Geography in Everyday Life in the new Upper Sec Geography syllabus.

We had always been using the inquiry-based learning in our Geographical Investigation. As we have completed the part on how nature benefitted people by lowering ambient temperatures via evapotranspiration and shade, I wanted to sparkle their curiosity on whether  vegetation and shade has an impact on temperatures within the school compound.


Inquiry-based learning is powerful as it engages the students by making real-world connections through exploration. The students collect and analyse the data that they have collected before they present and conclude.

https://knowledgequest.aasl.org/the-5-es-of-inquiry-based-learning/

A good trigger in SLS Activity A under Geographical Methods, prompting them to think of the research question and hypothesis which they can use in the fieldwork in school.  


I showed a map of the school, which I had traced from a Google Earth screenshot, and marked 5 sites which I gotten the class to guess which site has the highest temperature and give reason for their answer. Each group picked one which they think is the hottest. Then I lead them on to craft their hypothesis based on two measurable variables.


The instructions were given in Google Classroom which I have attached a Google spreadsheet which the groups can collaborate in the collection of data and analysis. The advantage of attaching the Google spreadsheet in Google classroom is that I can choose the option of them being able to  edit as a group. I do not need to add sharing rights to individual student. If there are other teachers in the group, they will be added too.


Each group recorded the data they measured and observed on the respective tab on the spreadsheet and I could see their live updates in class when they were at various spots collecting the data. I have projected the spreadsheet onto the screen and transferred their temperature data onto the whiteboard. That was when I noticed one group's data was quite off at 22 degree Celsius plus whereas the rest ranges from 26  to 27.6 Celsius degree. Halfway transferring the data, I saw the data being erased and the new ones recorded were above 26 degree Celsius.


Got the group to analyse the data they collected starting by calling out one student to calculate the mean (one of the geographical methods they had just learned). The rest looked on eagerly to see whether the spot they selected earlier was indeed the hottest.

While the student was calculating the mean, I checked on the group which has different data recorded at first. They looked a bit embarrassed and one of them said, "Mrs Lee, sorry we did not realise that we pressed on the weather tracker wrongly and measured density instead of temperature. But we ran back and remeasured all the spots". A teachable moment as I went through with the them the validity of data can be compromised by human error. 

We also noticed that one of the readings at the school field was exceptionally high, higher than that of the parade square. However, by averaging the data, the anomaly is reduced. Another authentic learning point about using data.

The groups made incredible observations too e.g. even within a site, some parts get some shade whereas some parts none due to the buildings casting a shadow. They were at the sites at different time throughout the 25 mins so the time could be also another influencing factor. One group even raised the question that our school field is made of artificial grass so the impact could have been different if it is real grass. More questions were raised and indeed might sparkle another round of investigation 😅  Great to get them curious!


The new syllabus did not really prescribe any GI but it also give rise to opportunity for the students to engage in a more authentic learning environment by deciding what they want to investigate. 

Another's class analysis on the bite sized fieldwork 22 Mar 2023. Changed one location from guard house to bamboo garden.


One more class bite-sized fieldwork on 29 Mar 2023


A copy of student's work 

https://docs.google.com/spreadsheets/d/1j_gzexJXlQ6jx5Nv8yMS-lJB8JAcBIOw_VUokub0G14/edit?usp=drivesdk


My Reflection:

𝗛𝗼𝘄 𝗱𝗶𝗱 𝘁𝗵𝗲 𝘂𝘀𝗲 𝗼𝗳 𝘁𝗲𝗰𝗵𝗻𝗼𝗹𝗼𝗴𝘆 𝗲𝗻𝗵𝗮𝗻𝗰𝗲 𝘀𝘁𝘂𝗱𝗲𝗻𝘁𝘀' 𝗹𝗲𝗮𝗿𝗻𝗶𝗻𝗴 𝗲𝘅𝗽𝗲𝗿𝗶𝗲𝗻𝗰𝗲?

Key Application of Technology: Assessment for Learning 

The interactive thinking skill tool in SLS allowed the students to process and improve on their answers based on the teacher's feedback. It also allowed thinking to be made visible. 

Key Application of Technology: Learn together 

The students were able to work on the collection and analysis of the data collaborately with the use of the Google spreadsheet. 

The use of Google Spreadsheet also allowed them to represent the data instantly with a bar graph through inserting a chart instead of drawing on paper. Important points such as title, labelling of axes as well as the values on the axes can be taught. They have also learned the skills of using a spreadsheet.

Through the inquiry-based learning, students learned in an authentic learning environment and not just facts from the teachers or textbook. They have learned that mistakes made can be a learning point too.

𝗪𝗵𝗮𝘁 𝘄𝗲𝗿𝗲 𝘀𝗼𝗺𝗲 𝗹𝗲𝗮𝗿𝗻𝗶𝗻𝗴 𝗱𝗶𝗳𝗳𝗶𝗰𝘂𝗹𝘁𝗶𝗲𝘀 𝘆𝗼𝘂𝗿 𝘀𝘁𝘂𝗱𝗲𝗻𝘁𝘀 𝗳𝗮𝗰𝗲𝗱?

As the students were given the task of crafting their research question and hypothesis on the ITT pre-lesson, there were a number of students showing difficulties in managing that. I had to clarify points such as whether there are 2 variables which can measured and whether it is feasible to be carried out in the school.

They were not able to change the minimum and maximum values for the Y-axis on the Google spreadsheet using their iPad so they actually changed it on my desktop.

𝗛𝗼𝘄 𝗺𝗶𝗴𝗵𝘁 𝘆𝗼𝘂 𝗺𝗼𝗱𝗶𝗳𝘆 𝘁𝗵𝗲 𝗹𝗲𝘀𝘀𝗼𝗻 𝘁𝗼 𝗵𝗲𝗹𝗽 𝘁𝗵𝗲𝗺 𝗰𝗹𝗼𝘀𝗲 𝘁𝗵𝗲 𝗹𝗲𝗮𝗿𝗻𝗶𝗻𝗴 𝗴𝗮𝗽?

I would give more scaffolding for the ITT task before using it as a trigger.

I have actually modified the lesson twice. One to change one of the sites to a more suitable location and second to auto reflect the group's data onto the main spreadsheet.

The above was what I adapted from the old syllabus weather GI: https://geogshare.blogspot.com/2021/05/blended-learning-for-gi.html

Sunday, March 22, 2015

Geographical Investigation of Water Quality

How to use the water test kit to check for turbidity, PH value and dissolved oxygen.


Turbidity

Definition:
Turbidity is the measure of the relative clarity of water. 

Importance:
Murkiness can give some clues to what may be in the water. There may be dissolved pollutants or bacteria. However, murky water does NOT necessarily mean there is pollution.

Steps for measuring turbidity:
1.Pour the collected sample water into the white container.
2.Compare the appearance of Secchi disk icon in the container to the chart.

Precautions taken to ensure accuracy of readings:
•Fill up the container to the turbidity line located on the label. Record the result as turbidity in JTU.

Dissolved Oxygen

Definition:
The dissolved oxygen is the amount of oxygen dissolved in a given volume of water, at a given temperature and atmospheric pressure.
This can be measured in milligrams per litre (mg/l) or parts per million (ppm).

Importance:
The amount of dissolved oxygen needed
     to sustain fish life is about 4 mg/l or 4 ppm.   

Steps for measuring dissolved oxygen:
1. Fill the vial with the water collected.
2. Ensure no bubbles visible
3. Insert 2 tablets for dissolved oxygen testing
4. Close the cover
5. shake continuously for 10 mins
6. Observe colour change and compare colour against the dissolved oxygen chart.

Precautions taken to ensure accuracy of readings for dissolved oxygen:
•Vial must be submerged into the white container while filling the vial with collected water. This is to avoid introducing bubbles in the vial.
•Always place the vial or test tube against the white background when comparing collected water with the given chart. 

PH value

Definition:
It is a measurement of acidity or alkalinity of an aqueous solution.

Importance:
Most aquatic animals prefer a range of pH 6.5 to 8.0.
pH can be affected by acid rain or wastewater discharges
If the living conditions have a pH value away from this range, these aquatic animals will either flee or die.

Steps for measuring PH value:
1. Fill the test tube up to the 10 ml mark 
2. Insert a PH tablet into the test tube.
3. Observe colour change and compare colour against the PH chart.

Precautions taken to ensure accuracy of readings:
•Always place the test tube against the white background when comparing collected water with the given chart. 

Saturday, June 30, 2012

Geographical Inquiry on Tropical Rainforest and Water Supply

Attended this workshop during the Humanities Educators' Conference by Andrew Turney on Geographical Inquiry in the Outdoors. We went to MacRitchie Reservoir to explore on the topic " water supply - "how clean is our waterway or waterbody?"

"Where am I?" personal and group evaluation

Testing water quality


water testing kit


Sketching the reservoir - annotation of the activities 

GI planning for Teachers 
1. Completion of RAMS 2 months before fieldwork
2. Notification of PUB 1 month before fieldwork - email to PUB_learning_Trails@pub.gov.sg the details - site, date, time, school, level, no. of students, teacher-student ration, teacher-in-charge and contact
Information of the learning trails available on www.abcwaterslearning trails.sg
3. collection of field packages from PUB for the conduct of fieldwork
4.Issuing and collection of consent forms
5. Logistics - first aid kits, booking of bus, field equipment (clipboards, nulon ropes, pail, water testing kit),. students to bring own camera
6. Print GI log, photo and map of the waterway prior to start of GI

Lesson 

  1. Students to generate questions to unpack and understand inquiry question, go through with students attributes of water quality and explain the importance of consulting reliable source.
  2. Ensure that students are clear of own as well as groups' responsibilities and roles, apply what they learnt on information literacy and identify secondary data useful to GI
  3. Quiz students on key terms related to GI on the topic of water and give instructions on use of water test kit
  4. Draw and annotate field sketch and annotate photograph
  5. Brief students on fieldwork, attire and conduct, issue and collection of consent forms, ensure logistics are completed and the students to submit GI log and group's progress check form
  6. Teacher to bring along emergency contact, first aid kit, distribute GI log, fieldwork equipment and clipboard. 
  7. Check on student progress - data collection, field sketch, photo-taking. Ensure return of equipment 
  8. Recorders share data collected on master recording sheet or online platform. Task students to analyse results
  9. Guide students to organise and present data - explain data meaningfully, draw comparisons and identify relationships to arrive at reasoned conclusion.
  10. Guide students to describe and explain limitations as well as suggest ways to improve GI. Students given 2 more weeks to submit powerpoint presentation, Group GI log, Personal reflection.


Friday, June 29, 2012

Geography Inquiry on Tourism

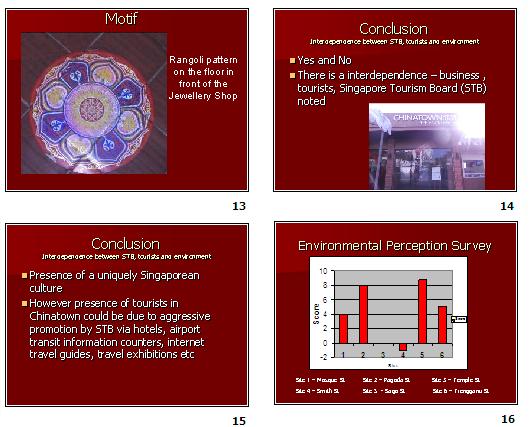
The first field inquiry on human geography which we have learned to be more open minded. We have also learned from each other the need to check whether the data collected is skewed.  We did a land use transect and learned to see the pattern e.g goods are sold mainly on the 1st level and services on the 2nd level, higher order goods such as electronics and jewllery shops are found along Pagoda street, Temple street and Trengganu Street which catered more to the tourists as compared to Sago street where there are. more pastry shops as it is nearer to the Kretar Ayer CC where more locals actually shop.  . However there is pastry shop along Sago. For almost all the tourists whom we interviewed, most are attracted by shopping as well as the temples nearby.

As Geographers, we need to look at the spatial distribution of the land use.  There is also a need to see the spatial patterns for Human Geography during post fieldtrip when collecting data.

Interesting findings of the different streets. Smith Street - food vendors of local delicacies but more expensive - a deliberate planning by STB to introduce the local food of the 60s. However almost all the stalls are not opened in the morning. It would be more appropriate to do the survey for this stretch of road in the evening. There are also more restaurants that are cosmopolitan e.g. Thai etc. there. We found out that many tourists would actually go for food that they are more familiar with as compared to trying the local food. There are a lot of accommodation such as hostel and budget hotels along Mosque street -most tourist book online and stayed there as it is relatively cheap. Here we could look at how amenities affect tourism. Most of them stayed there due to the availability of public transport such as MRT and public buses nearby. They have booked the stay online and most would have sourced the accommodation and nearby attractions on the internet. Thus we could also see how accessibility in terms of transport and information can attract tourists.


21 June 2012


Geography Inquiry on Coast

Our first activity at the East coast park was to label the low water mark, the high water mark, the shoreline and the coastline.


We then proceeded to our assigned area, cell G. The breakers here are higher and nearer to each other. We observed the symmetrical shape of the coastline so we came up with the hypothesis that the beach gradient should also be the same on both sides behind the breakers. However, after measuring the gradient, we realised that the gradient is steepest at the one on the West compared to the one facing the East. We suspected that the more gentle slope could be a results of the longshore drift. We threw an apple into the sea and the swash brought the apple up the shore and the backwash brought it back to the sea causing the apple to move from west to east. However, it took a long time for the apple to move eastwards. We also timed the no. of waves per min  - 20 per min which showed that the waves are strong and destructive. Thus the breakwater was quite effective - the coast which is actually reclaimed land would have given way to erosion if the coastal protection was not introduced. 


Using the downloaded application clinometer, we measured the gradient at every 1m interval from the high water mark with the tablet. Amazing what technology can do as in the past we have to carry the ranging poles and the clinometer to measure the beach gradient in order to plot the beach profile. When I downloaded the free app clinometer and smart compass from the Android Market , I also saw the 3D earthquake app which was so amazing - the next good app after google map!


The sketch which I did at the area we were assigned.


The East Coast Park is bustling with activities and can be very crowded during the weekends. Luckily we were there on a weekday. We saw people camping, jogging, cycling and a group of students who are ready to start their BBQ. We did interviews with the people and learned quite a bit.


This was our findings which we presented at the post fieldwork session.

20 June 2012

Geography inquiry on weather studies


We started off the activity with "human thermometer" for the five different sites.
Rating based on our senses without the instruments

Measuring of humidity is tedious with the sling psychrometer as we have to swing the instrument with 2 swings per sec which is like 120 round per min!


Sling Psychrometer - to measure humidity

Using the weather tracker, we compared the readings and tested our hypothesis on how the temperature was affected by the amount of shade and concrete surface area. Some areas are more exposed and floored with cement such as the parade square which resulted in the highest temperature recorded. In the areas which are more shaded and with soil such as the garden recorded the lowest temperatures.


I prefer to use this weather tracker which shows the humidity, temperature and wind speed - less tedious.

19 June 2012 at Raffles Institution