Showing posts with label Tourism. Show all posts

Thursday, April 25, 2024

AI video explorer

Sign in to school AI https://schoolai.com/

Select discover and select Video Explorer.


I have chosen a video on pro-poor tourism for the lesson.  
https://www.youtube.com/watch?v=p1bizZaKMac
Enter the YouTube video url.


You can also show the video to the class first and allow the students to explore the content of the video by asking questions or getting feedback from the AI. It is all personalised!

On the student's device.

The AI will provide questions to check on the student's understanding based on the video. 


The student's can also ask the AI questions such as the one shown below, diving deeper into the issue.


On the teacher's device, you can view the engagement level as well a summary of what the student's are engaged in. You can click on the 3 dots to view the individual student's chat. On the right hand side AI will suggest on what the student have feedback and can be used to extend the learning.


There is also option to download the AI insights on the individual student's learning.


The AI is even sensitive to the student's emotional wellbeing.  Above showed that the AI picked up that the student is very tired.

For students who responded not on the topic, AI is very patient to ask other questions and continued to affirm the student's responses.


Saturday, March 30, 2024

Trigger for lesson on tourism

Gotten my students to share their ideal holiday. To make it more immersive, I gotten them to take a picture of themselves and then superimposed their picture over a holiday destination of their choice using remove.bg

Instruction for the photo.

a. Download the background of a tourist destination you dream to be at.

b. Take a picture of yourself and goto https://www.remove.bg/ and remove the background of your picture.

c. Add the background of the picture you have downloaded. 

Instruction for the description of the ideal holiday on Padlet with the photo

a)state the country/city 

b)Reasons for choice 

c)Activities which you would like to do at the tourist destination 

https://padlet.com/teaching27/2024-3c1-tourism-va6dvyf9zsg7as8o

The students looked at the posts on the padlet after they have posted theirs. They were more engaged in the lesson and I was able to get them to relate to the tourism system and they could understand the concepts of push and pull factors via authentic examples given by their peers.

Wednesday, May 27, 2020

Virtual Learning Journey and simulated GI

The video below is a 360 video I took of the Chinatown LJ for Tourism GI I have conducted in 2020. You can also move horizontally through the 360 video by dragging your finger across the screen if you are using your handphone. You may also pause the video and swipe on the screen for the 360 view. Though you cannot experience the smell, the sight and sound would be an amazing VR experience. You can watch it in VR if you open up the video in Youtube. Experience the virtual reality with VR glasses. 

Virtual Tourism GI


More of 2020 tourism GI here 

Did a virtual Coastal GI in UK too using Google Earth. An overseas virtual learning journey!
Gotten the students to make observation using street view as well using the ruler in Google Earth to do measurements. I actually gotten the students to 'fly' back to Singapore to compare the size of the one we have at ECP with that in UK. Gotten them to think why are the breakwaters wider in UK.
Google Earth Kmz file and worksheet I have created can be downloaded from my Google site @

Sec 1 virtual Water GI using Google Earth. Let's fly over to Lorong Halus!
Students learn more about the history of the place.
https://sites.google.com/a/moe.edu.sg/sec-1-geog/geographical-investigation/5-lorong-halus-wetlands

They can also see how the place was in the past using the time slider with Google Earth.
https://sites.google.com/a/moe.edu.sg/sec-1-geog/google-earth

Then visit the various location via the street view on Google Earth.


An annotated sketch submitted by a Sec 1 student.

Will be customising the 2021 SLS lessons on GI to that on Lorong Halus. Will do the sharing on SGLDC on 23 Nov!

For sec 2 we actually gotten the students to annotate a picture of their neighbourhood to show why it is a unique place for them. Some were not able to be there so they made use of Google Earth and screenshot the street view/photo sphere for the 360 view. They could screenshot images of their neighbourhood and annotate them to show why it is unique to them.


Updated  5 June- Alex shared on the following 360 video of the Toa Payoh Neighbourhood.


This also reminded me of the sharing on using VR for Housing GI shared by Hua Yi sec
http://geogshare.blogspot.com/2019/11/vr-in-geography.html

Updated: use of VR in Geog and Eng by Ms Yong from Teck Whye Sec

Do also look at my earlier post on the use of MOE arcgis resources.
http://geogshare.blogspot.com/2020/03/arcgis-resources.html
 
I have always love Google Earth - My earlier posts on the use of Google Earth:
http://ezitnew.blogspot.com/search/label/Google%20Earth

The use of Google Earth definitely encourage real world exploration. It enables the students to overcome the constraints of space and time, bringing the world into the classroom. Google Earth allows students to locate and explore different parts of the world and the time slider allow one to compare the before-and-after images of an area.   This can definitely help to spark curiosity about the causes and impacts of change as what I have mentioned earlier about the Sec 1's study of Lorong Halus.  

In instances where the location of a study is difficult to reach, teachers can take students on virtual tours. Virtual tours may be in the form of the drag and drop Pegman icon on Google Street View's 3D view. The students could take a virtual trip to see why Machu Picchu in Peru attracts the tourists by moving around the ruins left by the Inca civilisation as well as experience the amazing view from the mountain top. 

Students can zoom, pan, and rotate the orientations of their screen in Google Earth to help them understand geographical space, place, and scale. As mentioned above, the students can use the search and zoom functions on Google Earth to explore Lorong Halus. The ability to observe features in Google Earth by manipulating the map scale actively and easily allows students to have a better sense of how the waterway, e.g Punggol waterway, are connected at a locale and even factors that may affect the water quality in the waterway. 

My Sec 3 students have also enjoyed measuring the breakwater in UK and compare that to the one at ECP using the ruler function in Google Earth. In doing so they could better understand the geographical concept of scale as well as making observations on the reasons for the difference in sizes.  Spatial analysis could be carried out and exploration of the real world without them actually being there with virtual field trips!

Updated 20 Oct 2020
Updated below is my Sec 3 virtual Coastal GI. Making use of Google Earth to help them see the authencity of their "fieldwork", simulated GI with measurement using samples, model, video clips etc at 7 stations in school! The students collaborated in the collection of data using Google Sheets and represent their data using Google slides.

Google Earth allowed my students to "fly over" to East Coast Park and Tanjong Rimau in Sentosa which will not be possible without the use of technology. It had definitely redefined the tasks.

 
You can make a copy of the Google sheet which the students used to record their measurements.

The 5 stations at East Coast Park, Singapore.

The 2 stations at Tanjong Rimau in Sentosa.


Explanation on the data collection methods before getting the group's to rotate on the 7 stations.


Virtual flight to ECP via Google Earth. Students took a screen shot and annotate to explain their observation on coastal process, coastal features and human intervention.

Measuring the wave frequency from recorded video taken at ECP.  Students imagine themselves to be at ECP looking at the place mark on Google Earth.


Sediment size analysis for larger sediment using a corner caliper.

Sediment size analysis for finer sediment using a weighing scale and sieves.

Measuring the slope of the beach facing the updrift and downdrift.

My HOD help me to guide the students in using the ranging poles and clinometer in measuring the beach profile.

Wednesday, April 1, 2015

Data representation in tourism

Data representation in tourism
We created Scatter graphs and other graphs using infogr.am. 
You can use the following link to calculate how far the country of origin of the tourist is from Singapore:
http://www.happyzebra.com/distance-calculator/farfrom-Singapore.php
We created an account @ http://infogr.am/ - click on "create" and then click on any of the infographics template. 


Double click on the text box and type in your title


Delete the chart and add a new one by clicking on "add chart" as shown below.


 Choose the type of graph you want your data to be represented.


Double click to edit the chart.


Clear all the data.


After you cleared all data,  open the excel file as shown below. Copy and paste the data back to infogr.am


You can also create a map with the same data - click on "add a map"


Demo on land transect using Google Map engine - use the polygon to create the polygon indicating the landuse. you can locate the place by using Google map in which you can refer to the street scene to confirm the area which you are plotting is correct.


Friday, June 29, 2012

Geography Inquiry on Tourism

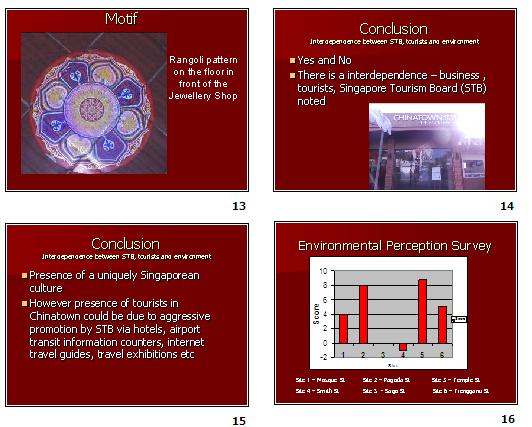
The first field inquiry on human geography which we have learned to be more open minded. We have also learned from each other the need to check whether the data collected is skewed.  We did a land use transect and learned to see the pattern e.g goods are sold mainly on the 1st level and services on the 2nd level, higher order goods such as electronics and jewllery shops are found along Pagoda street, Temple street and Trengganu Street which catered more to the tourists as compared to Sago street where there are. more pastry shops as it is nearer to the Kretar Ayer CC where more locals actually shop.  . However there is pastry shop along Sago. For almost all the tourists whom we interviewed, most are attracted by shopping as well as the temples nearby.

As Geographers, we need to look at the spatial distribution of the land use.  There is also a need to see the spatial patterns for Human Geography during post fieldtrip when collecting data.

Interesting findings of the different streets. Smith Street - food vendors of local delicacies but more expensive - a deliberate planning by STB to introduce the local food of the 60s. However almost all the stalls are not opened in the morning. It would be more appropriate to do the survey for this stretch of road in the evening. There are also more restaurants that are cosmopolitan e.g. Thai etc. there. We found out that many tourists would actually go for food that they are more familiar with as compared to trying the local food. There are a lot of accommodation such as hostel and budget hotels along Mosque street -most tourist book online and stayed there as it is relatively cheap. Here we could look at how amenities affect tourism. Most of them stayed there due to the availability of public transport such as MRT and public buses nearby. They have booked the stay online and most would have sourced the accommodation and nearby attractions on the internet. Thus we could also see how accessibility in terms of transport and information can attract tourists.


21 June 2012