Friday, April 1, 2016

Humanities Network sharing 2016 - Google sites

My sharing with the teachers in the humanities teachers on the use of Google Site for self-directed and collaborative learning. 

The use of google site allow students to be self-directed in their learning as they can select, manage, and assess their own learning activities any time beyond their curriculum time. To further engage the students in their learning, interactive resources such as Zaption interactive videos and Quizlet can be embedded into the Google site. 

Physical Geography Lessons http://tinyurl.com/sec3geog  
Human Geography Lessons tinyurl.com/sec4geog

Inquiry-based learning is infused through geographical investigation using the Google Site. The use of Google site helps the groups direct their geographical inquiry collaboratively as well as allowing them to review the steps needed in the geographical investigation to encourage self-directed learning. An example will be an inquiry on water quality by the Secondary 1 students from Edgefield Secondary School. I have also used Google sites to guide the students for GI on Coastal Studies and Tourism

Sec 1 GI on Water Resources 2015 http://tinyurl.com/watergi2015
Sec 3 GI on Coastal studies @East Coast Park   tinyurl.com/gicoast
Sec 4 GI on Tourism @ Chinatown tinyurl.com/gitourism

I have created two more google sites in 2017 - 
Sec 1 https://sites.google.com/a/moe.edu.sg/sec-1-geog/home
Sec 2 https://sites.google.com/a/moe.edu.sg/sec-2-geog/

Its also great for sharing resources among the department teachers as it is a secured platform which access permission can be controlled - only share with a certain group of people - intranet.


Google site from Lily Teo Hp

As I learn, I share. As I share, I learn.

I am happy that I have learned from the sharing of other teachers too. I would like to highlight in particular two of the sharing which I personally would like to try out.

Enhancing Students’ Subject Literacy for Open-ended 
Dayan Tan Ying Peng from Juying Secondary School
Dayan showed us how the school use the SMRT (Samples, Marking & Modelling, Rubrics, Template & Techniques) strategy to train students to become more competent writers in open-ended questions (level descriptor question).

From creating a writing framework for the students to designing a rubrics for them to see how they can attain the various level of competency. I also love how modelling is done using process writing and how the the teacher allows the student to see their competency level in their writing by indication it in the marking.

Love the techniques using acronym 123 - 1 stand, 2 sides, 3 points  as we had been using PEEL - point, explain, example and link.


Literacy Support for Students Interpretation of Visual Data in Geography
Linda Ng, Yvonne Poh, Nohani, Yamin, Leong Shu Jun from Jurongville Secondary School.

The teachers designed lesson activities to provide more literacy support and scaffolding with the hope that students can better make use of content vocabulary to express their thoughts more clearly and confidently when interpreting visual data.


Wednesday, March 9, 2016

Google Earth

You can download Google Earth free here: http://www.google.com/earth/download/ge/agree.html

This is how the screen will look when you open up Google Earth app or plugin.


Perform searches from the search box at the top left side of the program.
You can type a place name, zipcode or postcode, a town/city name, an airport or you can even try to type in a latitude-longitude location (in decimal format). Once you press the ↵ Enter key, you'll be "flown" to that destination.  You can take a virtual holiday!
You can also drag the little yellow man icon to the map and you will get to see street view. I do this before I visit a place so that I can navigate the place easily when I am there!

Use the zoom out and zoom in options from the buttons on the right hand side of the screen.
Turn the wheel in the top right corner to spin the item to a better understood angle. 

Click on Exit Street view to go back to the map.

Look for the date the picture was taken from the bottom left hand corner of the screen.
Scroll through the dates to see all the satellite images from different days of the year. 
Zoom to a place on the map where the satellite image has a date, click the "View" menu from the menu bar and click the "Historical Imagery" button to enable the feature. 
Drag the location of the toggle slider switch in the top left corner to a different date and see what the area was like. e.g. you can see what New Orleans was like after Hurricane Katrina, or one of the many famous historical times that date back to 1990! 


Use the Layers button from the bottom left hand side of the screen.
  • Turn on Weather view from the Layers button in the bottom left corner. Click the drop-down negative sign and next to Weather and click both the "Radar" and "Clouds" options. You'll be able to see rain and snow and clouds and sleet on this map, just like you were looking at a weather radar on a TV screen weather broadcasting channel.  (Temperature data has been dropped in 2017) 
  • Turn on other buttons for additional items to view about the location. You can turn on Panoramio photos from exact locations where others have taken pictures of landmarks worldwide, or even turn on YouTube videos when these videos have been placemarked. Look through that list, and see if you can turn on other very useful features that show the world from the eyes of other viewers.
  • Look at the locations of epicenters to recorded earthquakes by turning on the Earthquake feature in the Gallery drop-down.

Sunday, July 5, 2015

Combo Chart using Microsoft Excel

Creating combo chart using Microsoft excel is simple especially when you have two sets of data for the Y axis. As shown below - air temperature and relative humidity


This is especially so with climatic graph.

Download from the link below a template which you can use to generate the climatic graph.
http://lily_lee68.webs.com/Create%20climatic%20grah%20excel.xls

Wednesday, April 1, 2015

Data representation in tourism

Data representation in tourism
We created Scatter graphs and other graphs using infogr.am. 
You can use the following link to calculate how far the country of origin of the tourist is from Singapore:
http://www.happyzebra.com/distance-calculator/farfrom-Singapore.php
We created an account @ http://infogr.am/ - click on "create" and then click on any of the infographics template. 


Double click on the text box and type in your title


Delete the chart and add a new one by clicking on "add chart" as shown below.


 Choose the type of graph you want your data to be represented.


Double click to edit the chart.


Clear all the data.


After you cleared all data,  open the excel file as shown below. Copy and paste the data back to infogr.am


You can also create a map with the same data - click on "add a map"


Demo on land transect using Google Map engine - use the polygon to create the polygon indicating the landuse. you can locate the place by using Google map in which you can refer to the street scene to confirm the area which you are plotting is correct.


Sunday, March 22, 2015

Geographical Investigation of Water Quality

How to use the water test kit to check for turbidity, PH value and dissolved oxygen.


Turbidity

Definition:
Turbidity is the measure of the relative clarity of water. 

Importance:
Murkiness can give some clues to what may be in the water. There may be dissolved pollutants or bacteria. However, murky water does NOT necessarily mean there is pollution.

Steps for measuring turbidity:
1.Pour the collected sample water into the white container.
2.Compare the appearance of Secchi disk icon in the container to the chart.

Precautions taken to ensure accuracy of readings:
•Fill up the container to the turbidity line located on the label. Record the result as turbidity in JTU.

Dissolved Oxygen

Definition:
The dissolved oxygen is the amount of oxygen dissolved in a given volume of water, at a given temperature and atmospheric pressure.
This can be measured in milligrams per litre (mg/l) or parts per million (ppm).

Importance:
The amount of dissolved oxygen needed
     to sustain fish life is about 4 mg/l or 4 ppm.   

Steps for measuring dissolved oxygen:
1. Fill the vial with the water collected.
2. Ensure no bubbles visible
3. Insert 2 tablets for dissolved oxygen testing
4. Close the cover
5. shake continuously for 10 mins
6. Observe colour change and compare colour against the dissolved oxygen chart.

Precautions taken to ensure accuracy of readings for dissolved oxygen:
•Vial must be submerged into the white container while filling the vial with collected water. This is to avoid introducing bubbles in the vial.
•Always place the vial or test tube against the white background when comparing collected water with the given chart. 

PH value

Definition:
It is a measurement of acidity or alkalinity of an aqueous solution.

Importance:
Most aquatic animals prefer a range of pH 6.5 to 8.0.
pH can be affected by acid rain or wastewater discharges
If the living conditions have a pH value away from this range, these aquatic animals will either flee or die.

Steps for measuring PH value:
1. Fill the test tube up to the 10 ml mark 
2. Insert a PH tablet into the test tube.
3. Observe colour change and compare colour against the PH chart.

Precautions taken to ensure accuracy of readings:
•Always place the test tube against the white background when comparing collected water with the given chart. 

Sunday, January 25, 2015

Kahoot

Kahoot is very similar to Socrative as a free online assessment tool - just that the element of gaming is stronger as the player is given a score based on accuracy and speed. As there are more students who own smart phones nowadays, using Kahoot to do a quick check on understanding with the element of game will definitely engage the students.

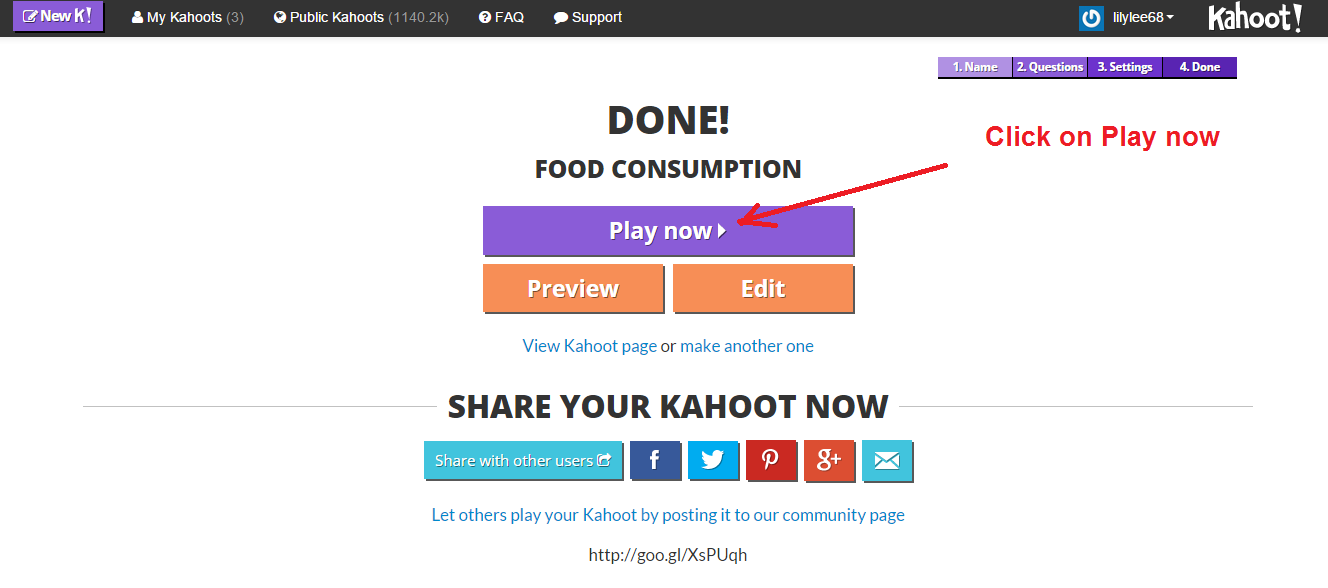
It is very easy to create the quiz. Just login to https://create.kahoot.it/


The following screen shoot shows what the students will see on his/her handphone.


The score is updated after every question!


 The winner is announced!

To launch the quiz again just login to https://create.kahoot.it/


You can search in the Public Kahoot. To locate and duplicate the one I have created, search for lilylee68. Or you can access the following links
Food: https://play.kahoot.it/#/k/1209bd54-4852-4396-b49e-91f1460c7d55
Temperature: https://play.kahoot.it/#/k/b733b365-5152-473d-b7c7-9ccc7a6be7fb
Climate change: https://play.kahoot.it/#/k/b95be120-ce84-4262-87ae-b371cb97b99f

Quizlet

I was introduced to Quizlet http://quizlet.com/ by the ICT mentor community. It's quite simple to create and is great to create flash cards. I have used it to create a set of flash cards to better  sec 1 Geography and water resources.
The students can click on the text and it will be read to them. You just have to input the word/image and its definition/meaning or the question and answer once and the whole study set of flash cards, test and games will be generated.

Choose the mode of study by scrolling down the menu at the bottom right hand corner. I love the scatter game and space race - try it out!
  • Learn and take the test
  • Scatter Game
  • speller Quiz
  • Test
  • Space Race

Quizlets on Geography - sec 1 Geography

Water Resource


Weather and Climate


Weather instrument

I will explore two apps shared in the ICT mentor NLC - http://versoapp.com/flip-your-thinking/ and http://www.socrative.com/