Stephanie from Peirce Sec created a chatbot for Upper Sec Pure Geo students:
Thursday, July 3, 2025
Thursday, April 10, 2025
Applying STP - facilitating collaborative learning with the use of ICT tools
A reflection on the Singapore Teaching Practice (STP) on the teaching process of lesson enactment - facilitating collaborative learning.
Collaboration and interactivity directly support students’ engagement, and can be facilitated using different learning platforms.
The use of ICT tools to foster collaboration and interactivity provides for a meaningful and engaging learning experience. When well designed, the use of ICT gives students the opportunities to actively interpret and to construct their knowledge, and not just have it transmitted from the teacher to the student (Jonassen, Peck, & Wilson, 1999).
I have decided to reflect on the above teaching action in one of the recent PD.
1. Brief description of one deliberate action taken in class to support student learning:
Getting the students to familiarize themselves with the stages of fieldwork design, I conducted a bite-size fieldwork in school. Before the fieldwork, the students used the ITT in SLS to craft the research question and hypothesis for their fieldwork in the school. With the ITT, students' response can be analysed and misconception addressed. The new IT has a new AI feature filtering the responses according to the level of mastery.
The students investigated the chosen hypothesis that the greater the amount of shade and vegetated ground surface, the lower the air temperature. The students collaborated using Google spreadsheet to record and analyse their findings at 5 selected areas in the school.
2. Teaching action identified under one of the 24 Teaching Areas and why it applies:
The use of ICT tools to foster collaboration and interactivity provides for a meaningful and engaging learning experience. When well designed, the use of ICT gives students the opportunities to actively interpret and to construct their knowledge, and not just have it transmitted from the teacher to the student (Jonassen, Peck, & Wilson, 1999).
3. Does this teaching action work consistently in my classes? How can we assess the effectiveness of our teaching actions?
Looking at the Steps for collaborative learning in STP:
Before the lesson:
Step 1:
Decide on the purpose and utility of using an ICT tool to engage the students. Determine how this tool can facilitate the achievement of the intended student learning outcomes as spelt out in the syllabuses (which includes relevant 21st century competencies to be developed).
Step 2:
Check the accuracy of content and processes in the digital resources.
During the lesson:
Step 3:
Provide opportunities for interactivity, collaborative inquiry, peer feedback, and teacher–student interaction as students construct their understanding.
Step 4:
Provide time for consolidation through student reflection.
After looking at the 4 steps introduced for effective collaborative learning, I would need to provide time for them to consolidate their learning by reflecting more on what they had learned.
4. Indicators that students may or may not be fully engaged or understanding:
The students collaborated in the analysis of the data they have collected. They were able to identify anomalies and form a conclusion on their hypothesis. They were fully engaged and also recorded photos of themselves collecting the data. By doing this bite-sized fieldwork, they could better understand the 5 stages in fieldwork design.

Students analysing the data they have collaborated and form a conclusion.
Copy of the spreadsheet - https://tinyurl.com/2mbttm48


Pictures taken by the students to show the different locations which they had recorded the temperature. It definitely reflected a high level of engagement.
Copy of the spreadsheet - https://tinyurl.com/2mbttm48
Wednesday, March 26, 2025
Excel on climate graphs
Getting the students to investigate the three types of climate with real data from worldclimate.com for Singapore, Bombay, India and Alaska, USA .
Students will also perform task such as calculating the temperature range, average temperature and total rainfall to better analyse the different types of climate.
The climate graphs are generated by highlighting the data (temperature and rainfall) and then insert chart wizard. Select combo chart and tick temperature as the secondary axis.

To get the students to look at real climate data and analyse the climate graphs.
Climate graph on spreadsheet
https://docs.google.com/spreadsheets/d/1IXy3EmGkZpXnkCOoVFA54RP32vQwr_NQgn2iB8QDqlY/edit?usp=sharing
Climate graphs on Excel
Monday, March 24, 2025
One Map
Access one map online https://www.onemap.gov.sg/ for base map and measurement.
Take note of the scale on the map.
Click on the pencil with ruler icon to carry out measurements on the map.

You can choose to measure straight line distance or the perimeter and area.


Wednesday, January 15, 2025
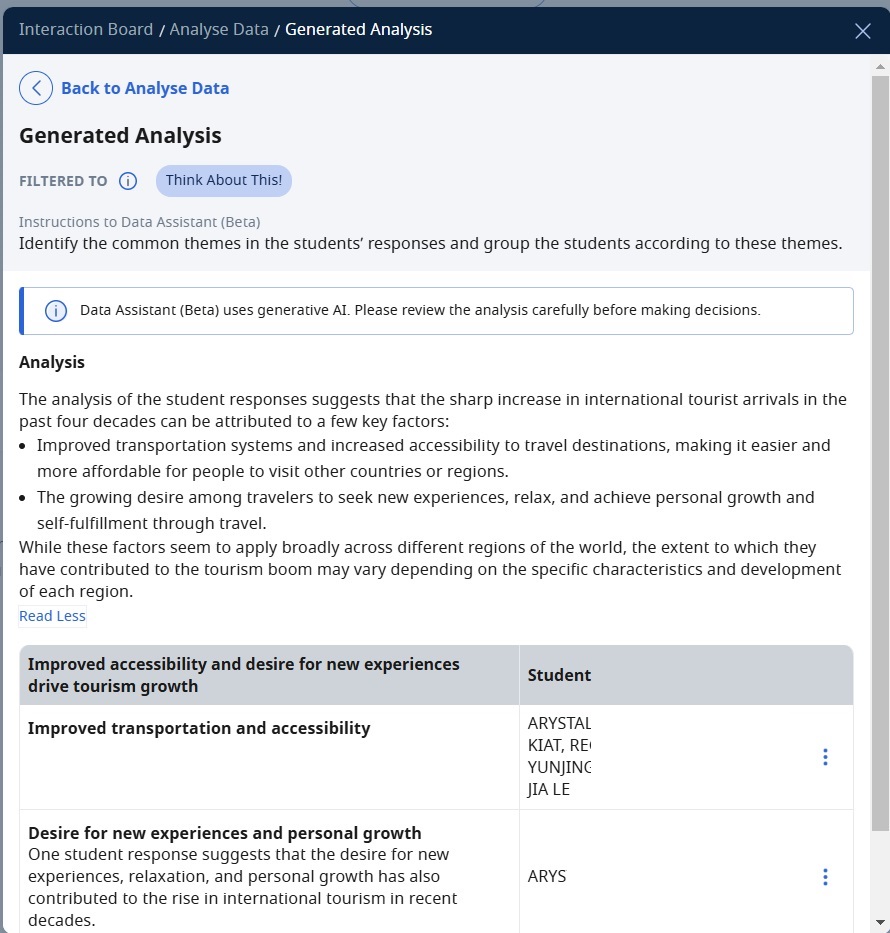
AI integrated ITT in SLS
The AI analysis in ITT function is already integrated. Simple to use to filter the responses. AI will generate the analyse but the downside is it cannot be saved so I had to screenshot.
It is simple to use - just click on the icon which I circled here. Then type in what you want AI to filter and analyse.


Tuesday, November 12, 2024
Sustainable development Batam
We took an hour ferry ride from Singapore to Batam. Left Singapore at 8am.


Passed by Sentosa
Reached Batam at 8am too as Indonesia time is one hour behind Singapore time.

Coastal protection at Batam ferry terminal.


Explored Batam's Pantai Sekoto beachfront area to learn about the mangrove in this area as part of the field study for Geography Symposium 2024. The programme was hosted by a member from Free the Sea – part of the WIK Group and the local volunteers. We looked into the impact of coastal erosion as well as the effects of the loss of this mangrove area.
The local outreach and education programme get the locals to be aware of the damage of the mangrove ecosystem and the mangrove restoration as well as replanting programme.
Drag on the screen for a 360 view
Learned so much on the efforts to reforest the mangrove from the local community and representative from Free the Sea


There are plans to develop ecotourism here.

The President planted 3 young plants here


Knee-like roots of Bruguiera exposed


Group photo with the volunteers and Wati (extreme left) from Free the Sea
After lunch, we visited the Free the Sea office in Panbil Industrial Estate to learn about the Plastic Recycling work that they do.
Free the Sea is a social enterprise which recyles plastic.

What Free the Sea does:
Preventing ocean plastic
22 collection points in Batam with contributions from individuals as well as 17 companies and hotels donation programme.


Source: Free the sea instagram
Challenges on expanding the programme: Some hotels are not willing to segregate the plastic waste or donate the waste as some have already sold the waste to someone.
For their collection partners, incentives such as paying higher than market rate for every kg of waste given.
Transforming waste
Recycling collected plastic waste is transformed into FTS recycled materials at the recycling facility
Upcycling material recovery facility repurpise waste, giving it a new life.
Empowering communities, regenerating nature
Scholarship were given as well as vouchers for necessities such as rice and oil were given.
The company organised clean up (300 volunteers) and health check up for 200 ( informal sector )
Social impacts such as support communities with social benefits
Environmental impacts such as organization of clean up events to raise awareness and lead restoration projects.
Education programme provides necessary skills and foster environmental responsibility
On site monitoring and audits for social and safety compliance.
The government help support capacity building e.g. sponsor Dati's study in Japan on waste management
Waste product which cannot be recycled will have to go to the regulated landfill e.g. around 10%
42 hectares of land for landfill. Coming up soon incinerator in 2 years working with the Chinese.
Dust collectors. The dust from grinding the plastic was also collected.
Reuse the water to conserve water resources.
WIK has 1000 workers in Batam. WIK originally manufacture small appliances. Started in 1950 in Germany. It is now based in HK. They started the Free the Sea and plastic recycling in Batam in 2013.
Use of solar energy. Heat generated by die casting used in other processing.
Free at the seas provided training for workers

Met the team from Free the Sea, including the head of Free the Sea, Bahri Beyhan. He gave us a guided tour of the plastic recyling facility.


Thanks to Raymond, our tour coordinator, for the following resources.
Some background information about Free the Sea
WIK Group is the bigger organisation that funds and runs Free the Sea
Climate action 101
Recommendation of similar organisations in Singapore Plastic Recycling in Singapore
Sustainable Eduaction such as urban farming https://www.metrofarm.com.sg/sustainable-education/
Ecofield trip to Malaysia by Green Sproutz Singapore.

Source: Green Sproutz Singapore Facebook page
Subscribe to:
Posts (Atom)