Saturday, June 30, 2012

Geographical Inquiry on Tropical Rainforest and Water Supply

Attended this workshop during the Humanities Educators' Conference by Andrew Turney on Geographical Inquiry in the Outdoors. We went to MacRitchie Reservoir to explore on the topic " water supply - "how clean is our waterway or waterbody?"

"Where am I?" personal and group evaluation

Testing water quality


water testing kit


Sketching the reservoir - annotation of the activities 

GI planning for Teachers 
1. Completion of RAMS 2 months before fieldwork
2. Notification of PUB 1 month before fieldwork - email to PUB_learning_Trails@pub.gov.sg the details - site, date, time, school, level, no. of students, teacher-student ration, teacher-in-charge and contact
Information of the learning trails available on www.abcwaterslearning trails.sg
3. collection of field packages from PUB for the conduct of fieldwork
4.Issuing and collection of consent forms
5. Logistics - first aid kits, booking of bus, field equipment (clipboards, nulon ropes, pail, water testing kit),. students to bring own camera
6. Print GI log, photo and map of the waterway prior to start of GI

Lesson 

  1. Students to generate questions to unpack and understand inquiry question, go through with students attributes of water quality and explain the importance of consulting reliable source.
  2. Ensure that students are clear of own as well as groups' responsibilities and roles, apply what they learnt on information literacy and identify secondary data useful to GI
  3. Quiz students on key terms related to GI on the topic of water and give instructions on use of water test kit
  4. Draw and annotate field sketch and annotate photograph
  5. Brief students on fieldwork, attire and conduct, issue and collection of consent forms, ensure logistics are completed and the students to submit GI log and group's progress check form
  6. Teacher to bring along emergency contact, first aid kit, distribute GI log, fieldwork equipment and clipboard. 
  7. Check on student progress - data collection, field sketch, photo-taking. Ensure return of equipment 
  8. Recorders share data collected on master recording sheet or online platform. Task students to analyse results
  9. Guide students to organise and present data - explain data meaningfully, draw comparisons and identify relationships to arrive at reasoned conclusion.
  10. Guide students to describe and explain limitations as well as suggest ways to improve GI. Students given 2 more weeks to submit powerpoint presentation, Group GI log, Personal reflection.


Friday, June 29, 2012

Geography Inquiry on Tourism

The first field inquiry on human geography which we have learned to be more open minded. We have also learned from each other the need to check whether the data collected is skewed.  We did a land use transect and learned to see the pattern e.g goods are sold mainly on the 1st level and services on the 2nd level, higher order goods such as electronics and jewllery shops are found along Pagoda street, Temple street and Trengganu Street which catered more to the tourists as compared to Sago street where there are. more pastry shops as it is nearer to the Kretar Ayer CC where more locals actually shop.  . However there is pastry shop along Sago. For almost all the tourists whom we interviewed, most are attracted by shopping as well as the temples nearby.

As Geographers, we need to look at the spatial distribution of the land use.  There is also a need to see the spatial patterns for Human Geography during post fieldtrip when collecting data.

Interesting findings of the different streets. Smith Street - food vendors of local delicacies but more expensive - a deliberate planning by STB to introduce the local food of the 60s. However almost all the stalls are not opened in the morning. It would be more appropriate to do the survey for this stretch of road in the evening. There are also more restaurants that are cosmopolitan e.g. Thai etc. there. We found out that many tourists would actually go for food that they are more familiar with as compared to trying the local food. There are a lot of accommodation such as hostel and budget hotels along Mosque street -most tourist book online and stayed there as it is relatively cheap. Here we could look at how amenities affect tourism. Most of them stayed there due to the availability of public transport such as MRT and public buses nearby. They have booked the stay online and most would have sourced the accommodation and nearby attractions on the internet. Thus we could also see how accessibility in terms of transport and information can attract tourists.


21 June 2012


Geography Inquiry on Coast

Our first activity at the East coast park was to label the low water mark, the high water mark, the shoreline and the coastline.


We then proceeded to our assigned area, cell G. The breakers here are higher and nearer to each other. We observed the symmetrical shape of the coastline so we came up with the hypothesis that the beach gradient should also be the same on both sides behind the breakers. However, after measuring the gradient, we realised that the gradient is steepest at the one on the West compared to the one facing the East. We suspected that the more gentle slope could be a results of the longshore drift. We threw an apple into the sea and the swash brought the apple up the shore and the backwash brought it back to the sea causing the apple to move from west to east. However, it took a long time for the apple to move eastwards. We also timed the no. of waves per min  - 20 per min which showed that the waves are strong and destructive. Thus the breakwater was quite effective - the coast which is actually reclaimed land would have given way to erosion if the coastal protection was not introduced. 


Using the downloaded application clinometer, we measured the gradient at every 1m interval from the high water mark with the tablet. Amazing what technology can do as in the past we have to carry the ranging poles and the clinometer to measure the beach gradient in order to plot the beach profile. When I downloaded the free app clinometer and smart compass from the Android Market , I also saw the 3D earthquake app which was so amazing - the next good app after google map!


The sketch which I did at the area we were assigned.


The East Coast Park is bustling with activities and can be very crowded during the weekends. Luckily we were there on a weekday. We saw people camping, jogging, cycling and a group of students who are ready to start their BBQ. We did interviews with the people and learned quite a bit.


This was our findings which we presented at the post fieldwork session.

20 June 2012

Geography inquiry on weather studies


We started off the activity with "human thermometer" for the five different sites.
Rating based on our senses without the instruments

Measuring of humidity is tedious with the sling psychrometer as we have to swing the instrument with 2 swings per sec which is like 120 round per min!


Sling Psychrometer - to measure humidity

Using the weather tracker, we compared the readings and tested our hypothesis on how the temperature was affected by the amount of shade and concrete surface area. Some areas are more exposed and floored with cement such as the parade square which resulted in the highest temperature recorded. In the areas which are more shaded and with soil such as the garden recorded the lowest temperatures.


I prefer to use this weather tracker which shows the humidity, temperature and wind speed - less tedious.

19 June 2012 at Raffles Institution 


Using Google Earth for Geography Inquiry

Attended the workshop by Paul Cornish on the use of Google Earth for Geographical Inquiry during the Humanities Educators' Conference 2012. Would definitely try this out - maybe for Kalimantan but need to find the resources first. Definitely good for self-directed and collaborative learning.
You can find out more from http://www.gecpd.com/p/ga-conference-2012.html

Rosewood Enquiry


Multimedia Geography through Google Earth from Paul Cornish
Embedding
Google Earth is constantly connected to the internet and constantly ‘streams’ satellite images. This gives the opportunity to create a ‘window’ in a place mark, and view photos, video and listen to audio hosted on other sites through the use of simple HTML code. 

Embedding Photos

From Flickr.com (photo sharing website):
  1. In GE, create a place mark
  2. Find the photo you want to use and  click ‘Share’
  3. Copy the HTML code
  4. Paste into the place mark
  5. Name the place mark  accordingly and add text
  6. Snapshot view

Embedding Video

From Youtube or Vimeo (video sharing websites):
  1. In GE, create a place mark
  2. Find the video you want to use and  click ‘Share’ and then ‘embed’
  3. Copy the HTML code
  4. Paste into the place mark
  5. Name the place mark accordingly and add text.
  6. Choose angle and snapshot view

Embedding Audio

From Audioboo.fm (audio sharing website):
  1. Use the Audioboo website to search for audio or create your own using the iPhone app.
  2. In GE, create a place mark
  3. Find the audio and click ‘embed’    
  4. Click ‘more options’ and choose ‘if all else fails’
  5. Copy the HTML code
  6. Paste into the place mark
  7. Name the place mark accordingly and add text
  8. Choose angle and snapshot view

Snapshot View

A snapshot view enables Google Earth to zoom into a pre-chosen angle to show video, photo or audio files
 1. Choose the angle and altitude for your place mark
2. Either right click on the file in the ‘places menu’ or right click on the    
    place mark
3. Click ‘snapshot view’


Geography of Food Seminar

Attended the seminar by GTA today http://gtasg.webnode.com/

Very informative and interesting presentation - must say we learned a lot from the 3 speakers.

I must say we learned much about what the AVA  is doing to ensure food safety and security in Singapore from Mrs Tan-Low Lai Kim.

I was surprised to learn that the consumption of whole fish is actually declining in Singapore. It seems that the youngsters prefer fish in the form of nuggets or fillet as they don't like whole fish with fish bones.

She also highlighted interesting facts such how the chicken rice vendors came to them for help when live chicken imports from Malaysia was banned in 2003 due to the avian flu outbreak. Consumption decreased rapidly then as compared to the outbreak in 2006. The AVA had improved the situation by banning by zones in a country rather than the whole country e.g chicken was supplied from Johor when there was an outbreak in Perak.

Being a country dependent on imports, food security often pose a problem. Emerging economies with increasing affluence might export less as their people become more affluent.

There is also a challenge in declining global food supply with declinging agricultural productivity, competition for essential resoueces such as water, arable land, labour and investment as well as diversion of food crops for biofuel production.

Of course other food security challenges include climatic change, outbreaks, natural disasters, political uncertainties, restrictive trade etc.

Key strategies which Singapore deployed:
1. diversification of food sources
2. stockpiking of essential food stocks
3. enhancing local production through small local farming
$10 million food fund introduced in 2009 - R&D in farming techniques e.g. fish breeding, vertical farming, seed banking
4. Promotion of food substitudes

It really makes us ponder about the food we are eating today. There is quite a good documentary on CNA tomorrow (10th April 2011) at 7pm - a preview of the show below:


No wonder one of the speakers, Dr George Jacobs, became a vegetarian. It seems that more people are becoming vegetarian not because of religion but rather due to health, environment and kindness (towards animals) concerns. It is a fact that much food has gone into feeding animals rather than hungry people - I suppose that's why there is a movement to be vegetarian once a week - www.facebook.com/veggiethursdaysg

The last speaker, Dr Pow Choon Piew, talk about the Hungry cities.
click here to see the no. of hungry people in the world
http://www.worldbank.org/foodcrisis/
imagine a billion people still hungry in the world

Geographical Inquiry June 2010


Geographical Inquiry for Upper Sec Teachers 6 June 2011
Trainer: Joseph and Margaret
Activity 1:Teaching style
  1. Questions – understand, open minded, non-critical
  2. questioning and AFL – KWL, Project work
  3. transfer of knowledge
Activity 2: what we already learn, what we want to know
Framework
Each Physical Geog topic or Human Geog topic is framed by an overarching issue and 3 Key Questions.
Each KQ has guiding questions, main ideas, learning outcomes, content and main terms.
First two KQs are posed to enable students to acquire knowledge and skills of the topic.
Third KQ, which entails the study of either an e.g. or a case study, requires students to apply knowledge and skills to reach a reasoned conclusion to the overarching issue.
The world according to (soue) Singaporeans by Mr Tan

Framework for learning through inquiring
1. Strategies to spark curiousity
Not only data – pictures, film etc
2. Gathering data
Locate, collect and select evidence
Sort, classify and sequence data
3. Exercising reasoning – to make connections e.g. relate existing knowledge to new knowledge, command words
4. Reflective thinking – to be critical in data sources, skills and techniques used, criteria for making judgements, opinions, what has been learnt, how it has been learnt, how the enquiry can be improved and developed further.

E.g. of Inquiry lesson
Key question: Which parts of the world experience earthquakes?
Leaning objectives:
Knowledge: Richter scale, world distribution of earthquakes
Skills: Interpreting maps, describing patterns
Terms: earthquake, focus, epicenter, magnitude, earthquake zone, tsunamis
Concepts: space, place, physical processes
Resources: lists and maps from USGS website, blank world maps
How many earthquakes were there in the world yesterday?
Show the students the data from USGS
Gathering data,
Exercising reasoning = students to see pattern
Get the students to name the oceans
Reflective thinking:
What patterns have been found?
Are the data sufficient?
How could the inquiry be improved?
What might be the reasons for this distribution?


Sparking Curiosity
How do we spark curiosity?
A: Stance (a teacher which has ignite your interest in the subject)
B: Stimulus (e.g. use of a photo)

C: Speculation
Intelligent guesswork
Rank top 3 and bottom 3 in terms of life expectancy
1. Japan 83.2
2. Australia 81.9
3. Italy 81.4 (olive oil, salad, healthier lifestyle)
14 Cambodia 62.2
15 South Africa 52
16 Lesotho 45.9
D: Choice
My volcano
Stereographic North Polar Aspect
Choice of writing - on any 3 countries along a longitude
Choice of products -Postcard or email or project folder of each country


Question-driven inquiry

Using Framework
Using core questions
What is the phenomenon?
Where is it located?
Why is it located there?
What impact does its location have?
What changes should be made?
What ought to be done?
Asking questions: the 5Ws
Why? Who? When? Where? What?

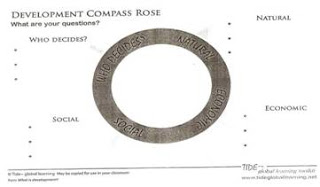
Using the development compass rose


Who decides?
What sort of help can be given to this place locally and internationally?
Natural
Where is this picture taken?
What climatic type is this place likely to experience?
Social
How extensive is the problem?
What is the social impact?
Economics
How can this child be helped economically?
What is the main economic activity?
What level of development will this place experience?
What is the economic impact


Video on coastal erosion – Pumpkin TV- Sustainable coastal management @ Holderness


Probe reasons and evidence
What are the factors which have led to a rapid rate of erosion in this coastal area?
What evidence is there from the film to support what you are saying?
Test implications and consequence
How does the coastal erosion affect the life of the local people?
What can the people or local authorities help the people overcome the problem?
Explore alternative views
Are there any other factors which contributed a rapid rate of erosion?
What are the similarities in coastal erosion in Singapore and UK?
Observer
Started with easy and progressed to more difficult question
Scaffolding – lower and higher level
Probe assumption
Rephrased questions when students are stuck

Student
Eased into difficult question
Encouraged to think further
Felt food praised
Connected
Kind teachers - encouraging
Teacher
Positive even
Affirmed student
Clarifying assumption
More wait time

What are the types of data can we use?
Where can I find the sources of data?
How do we select data?
Types of data
definition
examples
Primary data
Original information collected first hand by fieldwork
Measuring
Counting
Interviewing
Sketch mapping
Take photo
Secondary data
Information from published sources which was collected by someone else
Census data
Textbooks
Planning documents
Newspaper
Maps
Leaflets
Directories
Websites
photo
Different forms of data
Information can be represented indifferent ways:
  • Enactive
  • Iconic (images, diagrams, pictures)
  • Symbolic


Criteria in the selection of data:
What kinds of lies?
  • Stereotyping
  • Bias
  • Inaccurate information
  • Reliability
Primary data through questionnaire surveys
8 stages of using questionnaire: surveys
1. Establishing the scope
2. Devising questions
3. Producing the questionnaire
4. Collecting responses
5. Collecting data
6. Presenting the data
7. Interpreting the data and reaching conclusions
8. Evaluating the survey

8 common types of questions
  1. Choosing one answer from list of options
  2. Choosing one or more answers from list
  3. Ranking items
  4. Semantic differential (adjective – beautiful or ugly, clean - dirty)
  5. Rating using Likert scale (strongly agree, agree, disagree or strongly disagree)
  6. Fill in the blank
  7. Open list (e.g. which are the most recent countries you have visited)
  8. Open response
Questionnaires survey:
Possible sequence of lessons focusing on stages 1 – 8
Lesson 1
Teacher introduces focus
Students brainstorms questions
Teacher produces questionnaire
Lesson 2
Students write part of report including hypothesis
Lesson 3
Each student uses questionnaire
Teacher enters data into EXCEL
Lesson 4
Students analyse data, evaluate survey and complete reports

Advantage
Authentic data
Compare their data with what they learn
Check understanding
Encourage critical thinking
Pick up interpersonal/intrapersonal skills e.g. how to ask question
Source of data not available

How to help students
Models/frames
Critique practice
Scaffold – teach them research process (knowledge construction)
Test and review questionnaire
Instruction: Data analysis and collection
Clear in objective/purpose
Limitations
Key Questions
  1. Under what circumstances would it be appropriate to use this type of data?
  2. what issues do the students face when using such data?
  3. what data related skills do we need to teach the students?
Secondary data: statistics
e.g. Singapore climate
Mathematical knowledge required for O level Geog
Units of measurement e.g. mm, degrees celcius etc
Vocabulary e.g percentages, ratios, mean, median, mode
Skills eg. Line graphs, bar graphs, scattergraphs
Statistics in 3 inquiry contexts
  1. why has tourism become a global phenomenon?
  2. why do different places experience different weather and climate>
  3. what are the global patterns of health and diseases?
1. Why has tourism become a global phenomenon?
Numeracy
Units of measurement: totals; percentages
Vocabulary: arrivals; country of origin
Data: statistics; graphs; distribution maps
Inquiry process
Sparking curiosity: estimate
Gathering data
Exercising reason: analyzing data, drawing graphs, writing
Reflecting on learning: other data

Use of graphs
e.g. climate graphs
why do different places experience different weather and climate?
Numeracy
Units of measurement: Celcius; mm
Vocabulary: temperature; precipitation; relative humidity; annual range, diurnal range; diurnal range; mean monthly
Data: statistics; graphs; distribution maps
Inquiry process:
Sparking curiously: where in the world?
Gathering data/being provided with data
Exercising reason: describing climatic graphs
Exercising reason: comparing climatic graphs
Reflecting the learning: speculating on why different
Use of maps
What are the global patterns of health and diseases?
Numeracy
Units of measurement: calorie
Vocabulary: infant mortality, life expectancy
Data: statistics: graphs, pie charts; distribution maps
Inquiry process
Sparking curiosity; intelligent guesswork; making numbers real
Data: statistics; graphs; plotting graphs; producing maps
Making sense: describing patterns
Reflecting; being critical

Strategy: Intelligent Guesswork
http://www.worldmapper.org/display.php?selected=227
Gapminder: HIV epidemic 1980 -2007


Video on Ecotourism – Madagascar

Secondary data: Photographs
Strategies on the use of photographs
Brief glimpse
Where is it?
20 Questions


Directed Activities Related to Text
Reconstruction DARTs
  • Diagram completion (missing labels on diagram, to be filled up after reading the text)
  • Sequencing
  • Matching text and diagrams
Analysis and reconstruction DARTs
  • Labelling/reconstruction
  • Underlining or highlighting/reconstruction
Class discussion
Under what circumstances would it be appropriate to use this type ofl data?
What issues do the students face when using data?
What data related skills do we need to teach the students
Statistics
Analyse trend
Select and categorise data
Unit of measurement
Vocab
description
Graphs/charts
Analyse trend
Identify type and match
comparison
Read axis
Extract info
Unit of measurement
Calculation
e.g. total annual rainfall
Maps
Pattern
Comparison
Record of changes over time and space
Cannot identify countries
Confused by distortion of maps
Identification of places/countries
legend
Film
Authentic
Visual learner
Engaging
Case studies
Copyright
Missing data
Biasness
Miss out on parts of information
Framework
Guiding questions
To note key points
Photo/images
/diagrams
Spark interest
“field trip” in classroom
Compare
Study details
Help in explanation
Reliability
Limited information
Divide into 3 parts for photo analysis
Make geographical conclusions
Text
Content
Concept
Language
Difficulty level
Drawing linkages
Note-taking
Highlighting geographical concept
Similarities and differenes
Spider diagrams
Mindmaps

Concept mapping
Emphasis on links and realationships between concepts
Can be used:
  • Diagnostically
  • Reasoned thinking
  • Reflection/assessment
Writing frames and other support
e.g. Weather and Climate
(a) comparing and contrasting places
although India and Singapore are different, they are similar in some interesting ways.
For example, they both …..
They are also similar in …
They also have the same….
Finally they both …
(b) Use a grid to organize information about places and features before pupils use comparison and contrast frames.
Singapore
India
location
Mean monthly temp
Mean annual temp
Diurnal temp range
Total Annual precipitation


Using a writing frame to explain a process in Geography
I want to explain how monsoon winds are formed ……
It starts by…. And…..
This causes…
After that……
And as a result…
Then….
The final result is that….
Writing about an issue in Geography. Use a writing frame to present arguments and information about different viewpoints.
The issue that we discussed was about the effectiveness of measures adopted to mitigate and respond to the effects of tropical cyclones.
Some people think that….
Because….
They argue that….
Another group who agree with this point of view are..
They say that…
On the other hand….
Disagree with the idea that…
They claim that…
They also say that
My opinion is …
Because….

Role-play inquiry
Mauritius: Is tourism the way to go?
Sparking curiosity: connecting with own knowledge
Gathering data: information for each group
Exercising reasoning: role play: public meeting
Reflective thinking: debrief in role; debrief out of role
Should Mauritius aim to double the number of tourists by 2020?